The SafetyAware Control Centre portal includes powerful mapping features, that allow the user to display the location of assets and geofences on a map. By default, users can choose to display several different default map views, including Streets, Satellite Imagery or Streets Dark.
SafetyAware also includes the ability for a client to configure SafetyAware to show a custom map view. These map views can typically be used to show company-specific infrastructure, such as pipelines, mines, oil wells or gas plants.
This knowledge base article describes how to add this configuration, and also how to create the map layer using MapBox Studio tools.
Mapbox Integrations
Adding a Map Tile Layer
In order to change the Client Configuration to add a new map layer, the user must first have the “Client Administrator” permission. With this permission, the user should see the “Client” configuration menu. In the Client configuration menu in SafetyAware, there is a section to configure custom map layers in the Client Attributes section.
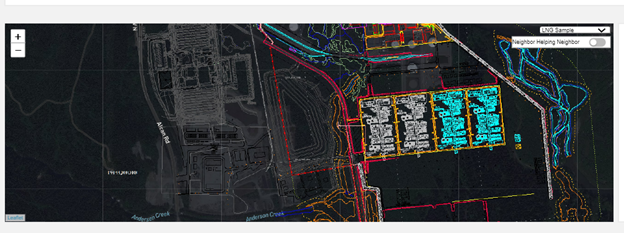
In this case, the “LNG Sample” layer is added by simply adding the Leaflet URL. This URL should point to a interactive map compliant with the Leaflet standard for interactive maps, documented here: https://leafletjs.com.
Once configured properly, the new map layer will appear in the pull down menu in the upper right corner of the map:
How to Create Leaflet URL from a Geo JSON file
A typical source for a map overlay showing the type of features generally displayed in this kind of overlay is a GeoJSON file. GeoJSON is a format for encoding a variety of geographic data structures, and is documented here: http://geojson.org. Generally, GeoJSON files can be created by most GIS mapping systems.
This section will describe how to create a Leaflet URL from a GeoJSON file using the tools in Mapbox Studio. Before starting, create a Mapbox account if you do not have one already.
Ultimately, the goal is to create a Mapbox Style, which can be published and shared as a Leaflet URL. In order to create a Mapbox Style, the GeoJSON file must be used to create a Mapbox Dataset, which in turn is exported to a Tileset, which can be added to a Mapbox Style as a layer.
Creation of a Mapbox Dataset
The first step is to import a GeoJSON file into Mapbox Studio as a Mapbox Dataset. A dataset is an editable collection of GeoJSON features.
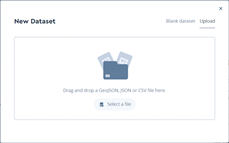
Mapbox Datasets are managed in Mapbox Studio here: https://studio.mapbox.com/datasets/. Create a New Dataset and upload the GeoJSON file.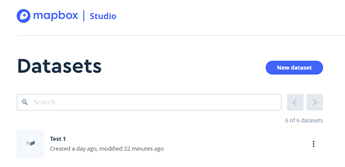
Once created, a Dataset is Exported into a Tileset. A Tileset is a collection of raster or vector data broken up into a uniform grid of square tiles at 22 preset zoom levels. In general, no editing should be required of the Dataset.
Once exported, a Tileset should appear in the Tilesets menu here: https://studio.mapbox.com/tilesets/ under “Custom Tilesets”.
Once created, a Tileset can be added to a Style as a Layer.
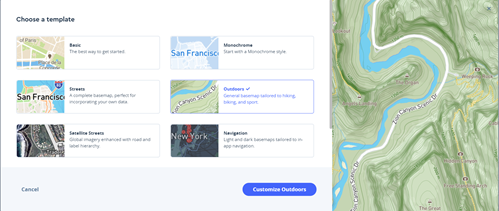
Create a new Style in the Style editor in Mapbox Studio here: https://studio.mapbox.com/.

Choose a template to be used as a basis for the overlay. Generally, the Outdoor style works well with SafetyAware, but others are available. Click the “Customize” button to add the Tilesets as layers.
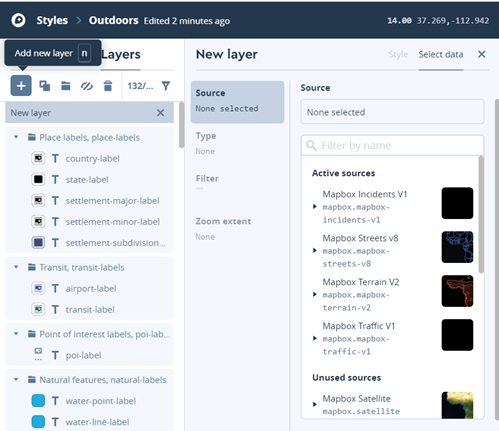
Add a new layer by selecting the “Layers” menu and “Add a new layer”. The Tilesets previously created should appear under the “Unused Sources” field in the list on the right. Add a new layer for each Tileset created.
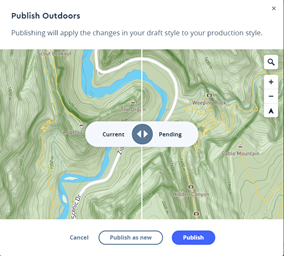
When all layers have been added, “Publish” the Tileset with the button on the upper right corner of the Style Editor menu.
Once published, create a URL by pressing the “Share…” menu on the upper right of the Style Editor menu.
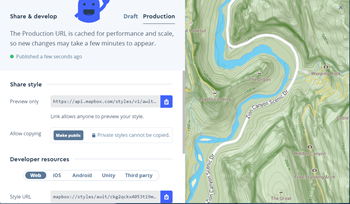
Copy the URL under “Share style” starting with https://api.mapbox.com/styles/v1/ . . .
Paste this URL into an appropriate editor, such as Notebook.
Before using this URL in Control Centre, it must be first changed into the Leaflet URL format.
Change the highlighted field in the URL below:
to this:
The remainder of the URL should remain the same. This can now be used in the “Leaflet URL” field in the Control Centre Client Configuration menu, as described above.